curve(x^2, from = -5, to = 5, n = 500, col = "red", ylab = "f(x)")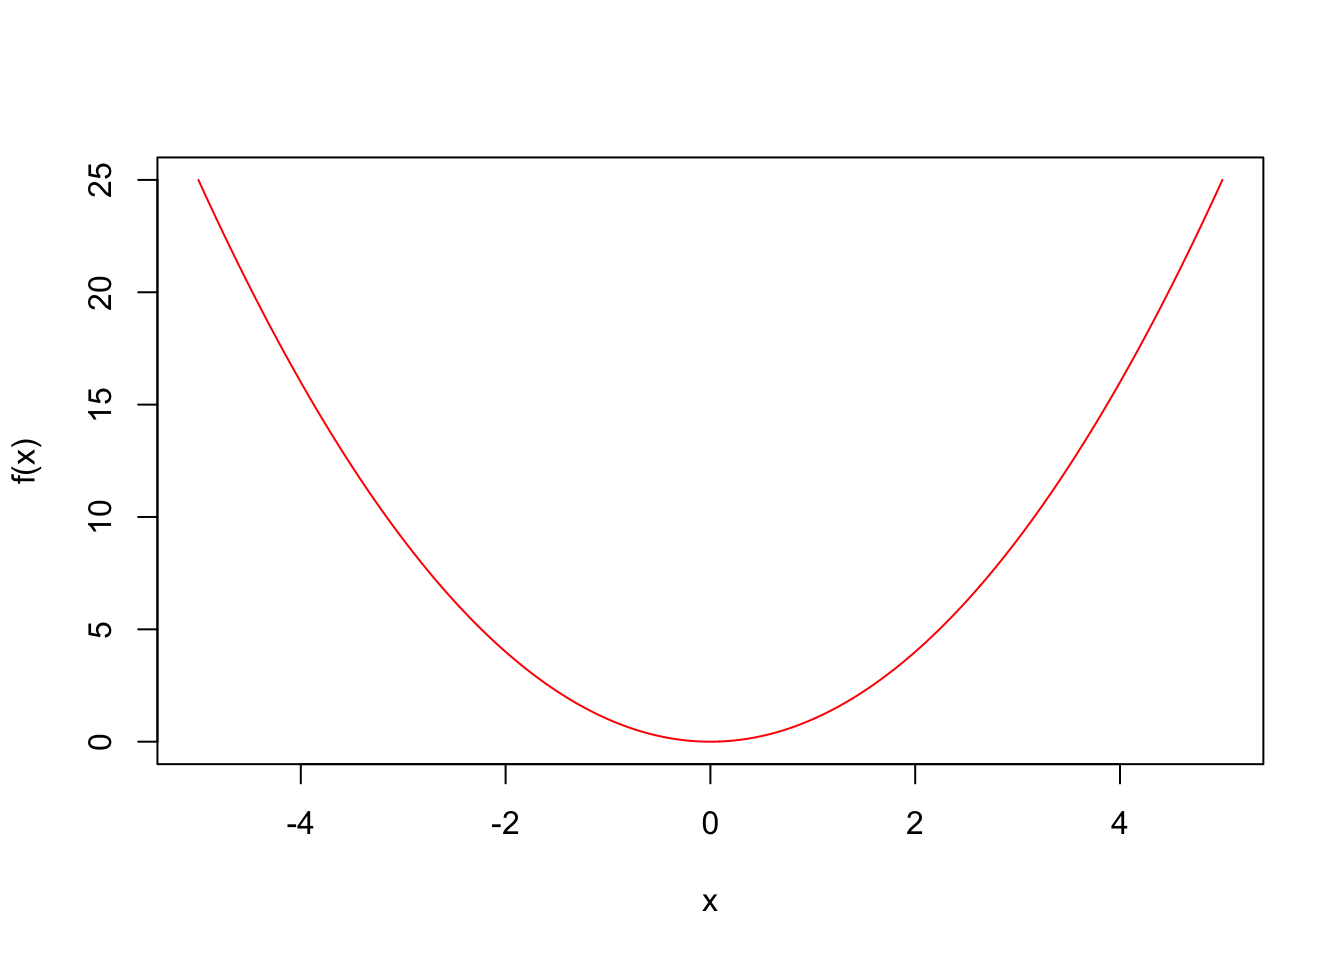
You can use the curve function to plot a line graph of a function. If that function were \(f(x) = x^2\) for example, you would type this:
curve(x^2, from = -5, to = 5, n = 500, col = "red", ylab = "f(x)")
This function takes many arguments.
curve command implicitly assumes that x is the argument, and everything else is constant;from and to give the bounds of the \(x\)-axis;n specifies how many dots. Too few, and the picture would look all cattywampus:curve(x^2, from = -5, to = 5, n = 5)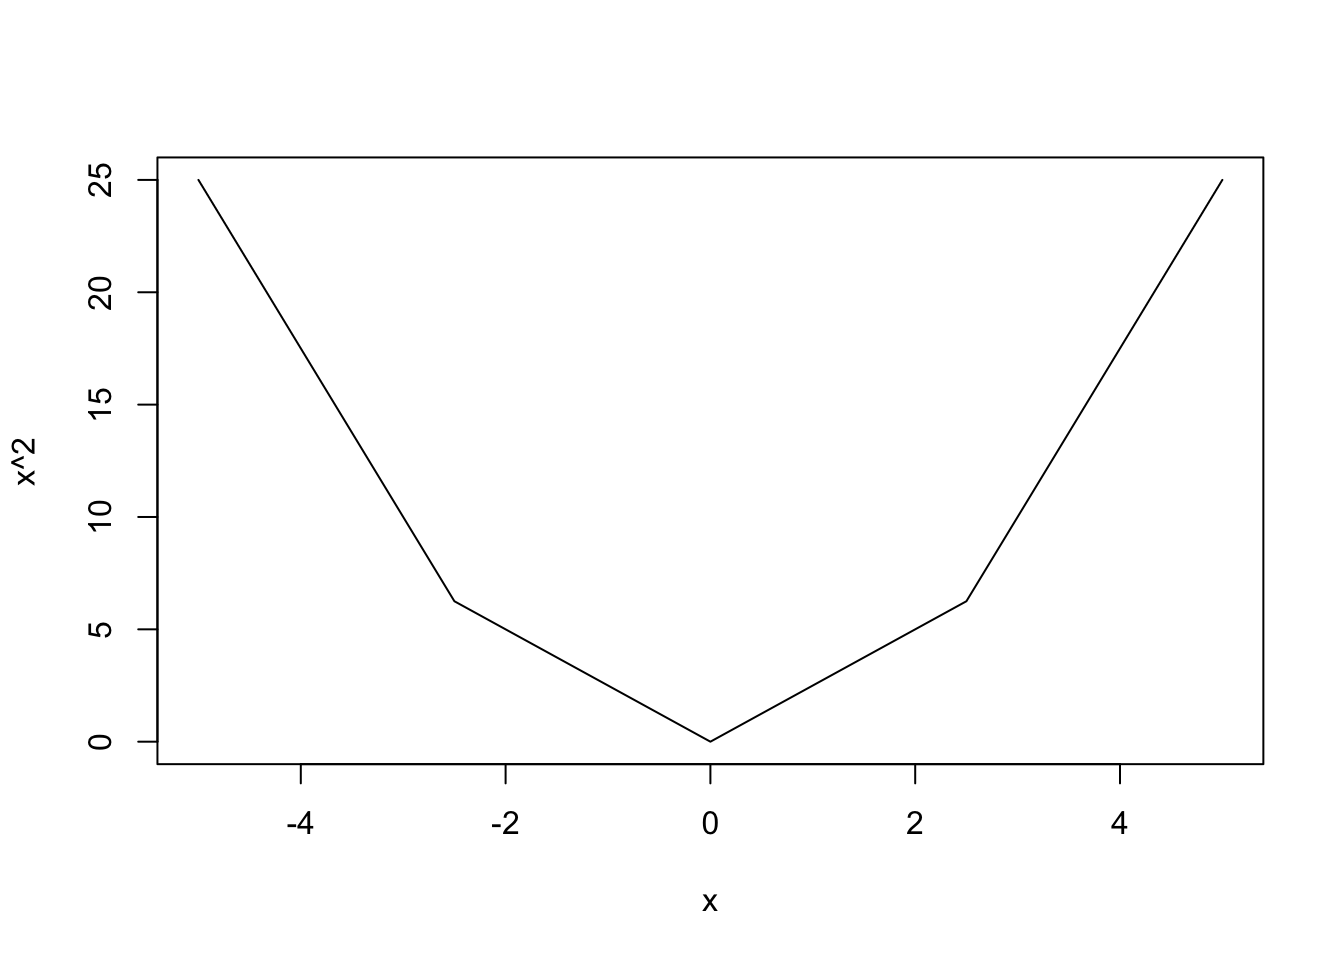
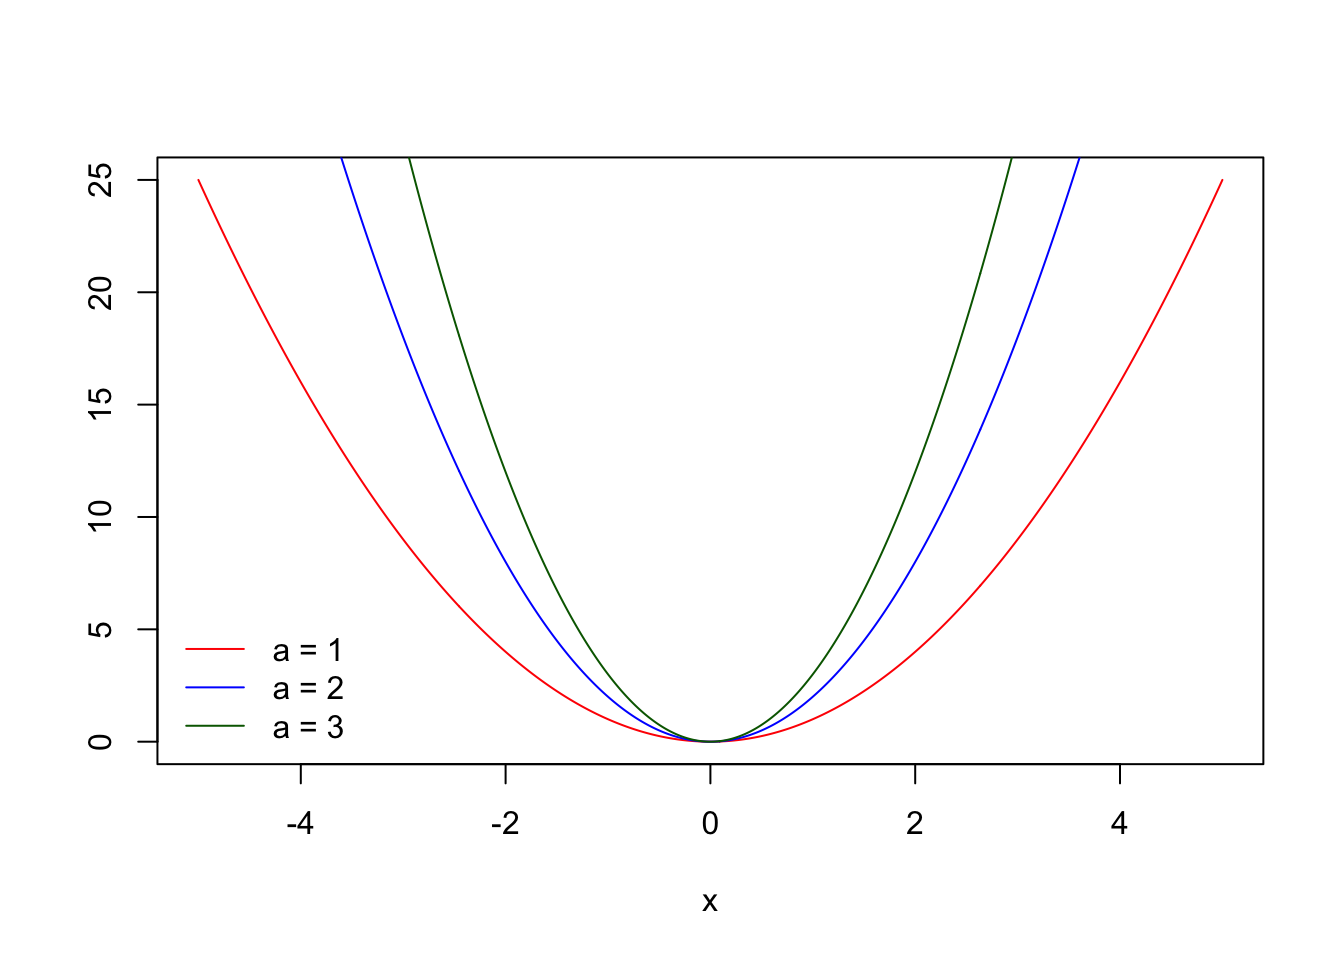
If you want multiple lines on one graph, you can call curve multiple times, and include the add argument in all but the first call:
curve(1*x^2, from = -5, to = 5, n = 500, col = "red", ylab = "")
curve(2*x^2, from = -5, to = 5, n = 500, col = "blue", ylab = "", add = TRUE)
curve(3*x^2, from = -5, to = 5, n = 500, col = "darkgreen", ylab = "", add = TRUE)
legend("bottomleft", c("a = 1", "a = 2", "a = 3"),
       col = c("red", "blue", "darkgreen"), lty = 1, bty = "n")