Not all election challenges are frivolous and cynical. Sometimes there are illegal/ineligible ballots in a close election, and if a candidate raises a legal challenge, a court must make a decision: certify the original results? adjust the vote totals somehow, possibly reversing the election? void the results entirely and order a new election? The concern of course is that the presence of the bad ballots might have swung the outcome, but how likely is this? Let’s model it.
Imagine an election where Angela Lansbury receives \(a\) votes, Bernadette Peters receives \(b\) votes, and Angela provisionally wins with a margin of victory \(a-b>0\). However, of the total \(a+b\) votes, we learn that \(k>a-b\) were invalid or illegal. But we know nothing else. We do not know who these folks are, where they came from, or who they voted for. We just know that they exist. If the \(k\) invalid ballots were removed from the total, what is the probability that it would flip the result of the election? If this probability is “too big,” we might start to worry.
To model this, think of the original \(a+b\) ballots as balls in the proverbial urn. \(a\) of these balls are red, and \(b\) of these balls are blue, and assume that \(a,\, b>k\). Removing the \(k\) invalid ballots is like drawing \(k\) balls out of the urn without replacement. Since we know nothing about the illegal ballots apart from the fact that they exist, assume that each of the \(a+b\) original ballots is equally likely to have been invalid. Next, imagine we randomly remove \(k\) balls from the urn, and let \(X\) be a random variable that counts the number of the removed/invalid ballots that belong to Angela. In other words, the number of red balls removed. If \(X\) is large enough, it will swing the election in Bernadette’s favor.
What are the range and the pmf of the random variable \(X\)?
For what values of \(X\) does removing \(k\) ballots reverse the outcome of the election?
Based on your answers to the previous parts, what is the probability that the election result is reversed when the \(k\) bad ballots are removed? Give a general formula for this probability, and then compute the probability for each of the real elections listed in Table 1;
The random variable \(X\) that you derived in the first part can be approximated by \(\text{Binom}(k,\,1/2)\). Explain why this approximation might be “good enough,” and verify that it’s not too bad by computing the approximate probability of reversal for the elections in Table 1. Compare the approximate probabilities to the actual ones from the previous part;
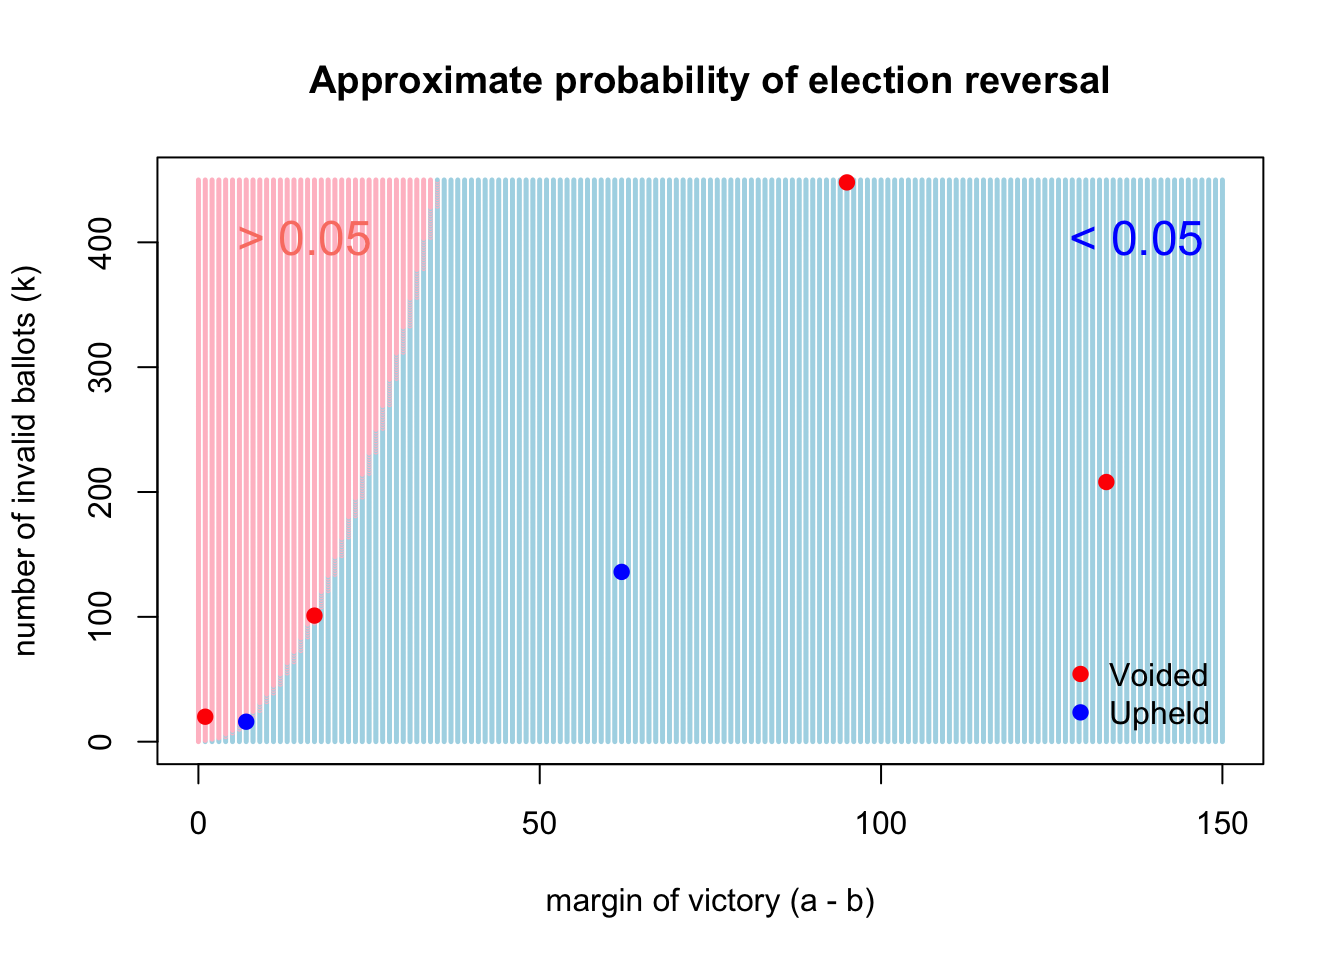
Let’s say that we consider the probability of reversal “too big” if it is greater than 5%. Create a plot in R like Figure 1 with the following features:
the margin of victory \(a-b\) on the horizontal axis;
the number of bad ballots \(k\) on the vertical axis;
scatterplot where each point represents an election in Table 1, with the points colored according to the decision that was made in the case;
divide the plane into two regions, one where the approximate probability of reversal is less than 0.05 and one where it is greater.
Write a few pithy paragraphs commenting on the following:
the assumptions of our lil’ model. Do you think they are innocuous? What might you change, and how?
the match or lack thereof between our model and the decisions that were actually made in the real cases;
How do you think a court should handle a legitimate election challenge? What are their responsibilities to the electorate, and what should they prioritize? Should they err on the side of upholding or voiding results? Should they think probabilistically? Should they consult this model, or one like it?
Table 1: Close elections
election
year
win
loss
total
margin
invalid
decision
Ippolito v. Power
1968
1,422
1,405
2,827
17
101
void
Santucci v. Power
1969
58,076
57,981
116,057
95
448
void
DeMartini v. Power
1970
2,656
2,594
5,250
62
136
upheld
Maine House
1976
1,193
1,060
2,253
133
208
void
Ann Arbor mayor
1977
10,660
10,659
21,319
1
20
void
Brunswick ME town council
1980
2,390
2,383
4,773
7
16
upheld
Washington governor
2004
1,373,357
1,373,228
2,746,585
129
1,439
upheld
Code
elections<-data.frame( election =c("Ippolito", "Santucci", "DeMartini", "Maine", "Ann Arbor", "Brunswick", "Washington"), a =c(1422, 58076, 2656, 1193, 10660, 2390, 1373357), b =c(1405, 57981, 2594, 1060, 10659, 2383, 1373228), k =c(101, 448, 136, 208, 20, 16, 1439), decision =c("void", "void", "upheld", "void", "void", "upheld", "upheld"), col =c("red", "red", "blue", "red", "red", "blue", "blue"))reversal_prob_binom<-function(a, b, k){cutoff=ceiling(0.5*(k+a-b))1-pbinom(cutoff-1, k, 1/2)}margin_grid<-0:150k_grid<-0:450n_points<-length(margin_grid)*length(k_grid)grid<-data.frame( margin =numeric(n_points), k =numeric(n_points), color =rep("lightblue", n_points))row<-0for(xinmargin_grid){for(yink_grid){row<-row+1grid[row, 1]<-xgrid[row, 2]<-yif(reversal_prob_binom(1+x, 1, y)>=0.05){grid[row, 3]<-"pink"}}}plot(grid$margin, grid$k, col =grid$color, pch =19, cex =0.2, xlab ="margin of victory (a - b)", ylab ="number of invalid ballots (k)", main ="Approximate probability of election reversal")points(elections$a-elections$b, elections$k, pch =19, col =elections$col)legend(-7, 450, "> 0.05", text.col ="salmon", bty ="n", cex =1.5)legend(115, 450, "< 0.05", text.col ="blue", bty ="n", cex =1.5)legend(125, 85, c("Voided", "Upheld"), pch =19, col =c("red", "blue"), bty ="n")